The past decade has represented the longest equity bull market in history.
Happy New Year! We hope that your holiday season was wonderful and wish you all the best for a happy and healthy 2020.
Not only has another year passed us by, but this also marks the end of a decade as well. We will reflect on this past year and decade as well as offer our insights into the coming year ahead.
2019 produced impressive investment results. US markets performed especially well. After returning 9.07% in the fourth quarter, the S&P 500 Index was up 31.49% for the full year. International equity markets lagged the US but still posted strong returns, with the Bloomberg World Index up 24.40% for 2019. Bonds also posted a solid year as the Barclays Aggregate Bond Index was up 8.72% for 2019.
After a tough third quarter, the three main equity strategies that we manage at Biondo rallied in the fourth quarter to produce respectable returns. For the fourth quarter, The Biondo Growth Strategy was up 11.14%, while the Biondo Focus Strategy was up 15.49%. The Biondo Dividend Strategy was up 6.83% in the quarter. For the year, the Growth Strategy was up 19.46% and the Focus Strategy was up 23.06%. The Dividend Strategy was up 25.7% for the full year. Many of our clients have exposure to more than one of these equity strategies, as well as to International and/or Fixed-Income, so results will vary according to the allocation.
The decade just ended has represented the longest equity bull market in history. Since 1926, there have been 13 bull markets (periods of rising markets without a 20% decline) that have averaged 53 months in duration. December 2019 marked 129 months and counting of this current bull run, beating the previous record of 113 months during the 1990s. This has been a very measured and consistent rally. Despite constituting almost all of this record bull run, the 2010s were only the 4th best performing decade out of the past seven, returning approximately 10.8% annualized. This trails the 1990s (15.3%), 1950s (13.6%) and 1980s (12.6%) by a meaningful margin.
The 2010s also contained many news items that not only moved markets, but changed the way they operate. Lawmakers passed the Dodd-Frank Bill, the S&P downgraded the US for the first time in history, and Facebook’s sputtering IPO has changed how new companies now come to market. The US also became a net exporter of oil and fuels for the first time in decades, the Obama Administration restored diplomatic ties with Cuba, China cemented its status as a world power, and Donald Trump rode a populist wave to the presidency.
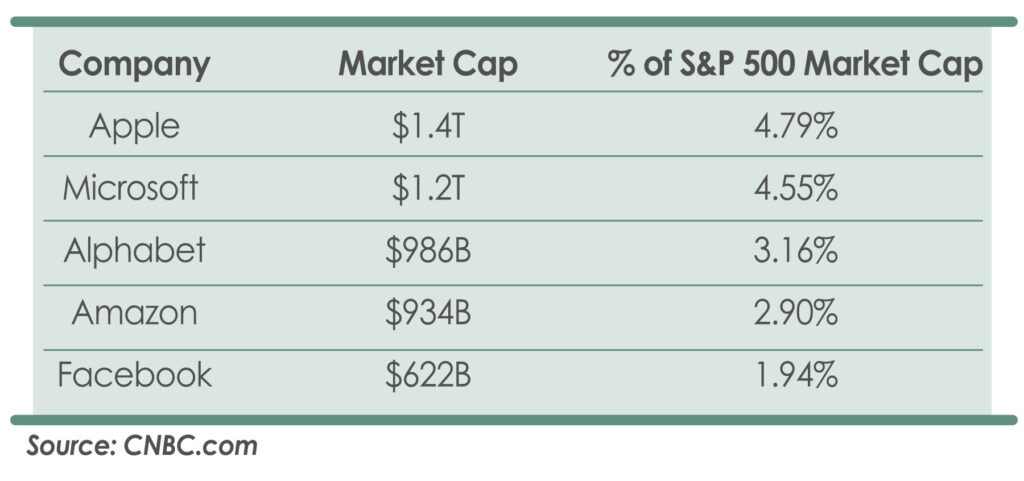
The 2010s were also the decade of smartphones, digital streaming and five massive tech companies. Apple, Microsoft, Alphabet, Amazon and Facebook now make up 18% of the total market cap of the S&P 500, an unprecedented level of dominance. Apple and Microsoft alone accounted for 14.8% of the S&P market gains in 2019.
2019 also benefited from unprecedented levels of Fed stimulus in the form of the repurchase-agreement, or repo, market. This process involves the Federal Reserve’s purchases of treasury bills in the overnight repo market, with the purpose of adding liquidity to the markets. Markets have been on a tear since this current facility was put in place in October. So far, the Fed has used this tactic to expand its balance sheet by $400B. The last time the Fed injected this much liquidity into the markets was in 2009, when about $120B was injected into the markets in order to fuel a recovery following the credit crisis. Funds from these liquidity events usually get funneled to the best performing markets. In 2009, that was the bond market. This time around it has been the stock market, particularly mega cap stocks, that has benefited.
This Fed-fueled frenzy, combined with healthy corporate earnings ten years into an expansion, has led to significant wealth creation in 2019 alone. According to Wilshire Associates, the value of US equities increased by $7.5 trillion, or almost 28% in 2019. From the Christmas Eve 2018 low, the rise was even more pronounced, totaling about $9.2 trillion, or 36%. This past year marks the best year for value creation since 2013, when equities added $5.4 trillion to investors’ total wealth.
As we begin 2020, we remain focused on the primary drivers of investment returns – corporate earnings and valuations. Expectations are for earnings growth to slow relative to 2019, yet valuations appear to be stretched compared to this time last year. A year ago, the S&P 500 traded at roughly 19 times forward earnings and today we are at about 24.5 times forward earnings, the second highest multiple in over 10 years.
Given all of this, we have grown more cautious in our outlook as we begin 2020. Certain technical indicators that we employ in our investment process are flashing warning signs. While markets are pushing to all-time highs, money flows and relative performance are displaying divergences that have not been seen since late 1999. Market leadership has narrowed significantly, as noted earlier, best displayed by nearly half of the total return of the S&P 500 fueled by two stocks in 2019. The percentage of stocks in the S&P 500 showing positive relative performance is 34% currently, while 50%+ typically accompanies a healthy market. We are not making a major market call, rather remaining disciplined investors and have and will be trimming position sizes to reflect the elevated risk levels of the current environment. As investors, it is important not to over-emphasize individual positions but to focus on your investment portfolios as a whole. It is our responsibility to remain disciplined, to not allow emotions to block our decision making and to align our strategies with the risk management parameters that accompany them.
We are always committed to adjusting to an ever-changing landscape, performing sound research and exercising common sense. This involves not only individual security selection, but asset allocation and risk management decisions with the goal of meeting your individual investment needs.
Please feel free to contact us at your convenience to discuss your specific situation and how the various strategies that we offer can accommodate your needs. As always, we appreciate the trust and confidence you have placed in us and we appreciate the opportunity to serve your investment needs.

Scott A. Goginsky, CFA®
Partner
Research Analyst
Portfolio Manager
Sources: returns; HAS –Wealthscape, Gemini Fund Svcs, Bloomberg, USNews – earnings growth; Bloomberg – S&P 500 & DJIA 2019 YTD, CNBC.com, multpl.com, Brogan Research- decade review; Wall Street Journal, Dow Jones.com – fed reserve: Barron’s
The information set forth regarding investments was obtained from sources that we believe reliable but we do not guarantee its accuracy or completeness. Neither the information nor opinion expressed constitutes a solicitation by us of the purchase or sale of any securities. Past performance does not guarantee future results.
Fourth Quarter Review 2019
Scott A. Goginsky, CFA®
The past decade has represented the longest equity bull market in history.
Not only has another year passed us by, but this also marks the end of a decade as well. We will reflect on this past year and decade as well as offer our insights into the coming year ahead.
2019 produced impressive investment results. US markets performed especially well. After returning 9.07% in the fourth quarter, the S&P 500 Index was up 31.49% for the full year. International equity markets lagged the US but still posted strong returns, with the Bloomberg World Index up 24.40% for 2019. Bonds also posted a solid year as the Barclays Aggregate Bond Index was up 8.72% for 2019.
After a tough third quarter, the three main equity strategies that we manage at Biondo rallied in the fourth quarter to produce respectable returns. For the fourth quarter, The Biondo Growth Strategy was up 11.14%, while the Biondo Focus Strategy was up 15.49%. The Biondo Dividend Strategy was up 6.83% in the quarter. For the year, the Growth Strategy was up 19.46% and the Focus Strategy was up 23.06%. The Dividend Strategy was up 25.7% for the full year. Many of our clients have exposure to more than one of these equity strategies, as well as to International and/or Fixed-Income, so results will vary according to the allocation.
The decade just ended has represented the longest equity bull market in history. Since 1926, there have been 13 bull markets (periods of rising markets without a 20% decline) that have averaged 53 months in duration. December 2019 marked 129 months and counting of this current bull run, beating the previous record of 113 months during the 1990s. This has been a very measured and consistent rally. Despite constituting almost all of this record bull run, the 2010s were only the 4th best performing decade out of the past seven, returning approximately 10.8% annualized. This trails the 1990s (15.3%), 1950s (13.6%) and 1980s (12.6%) by a meaningful margin.
The 2010s also contained many news items that not only moved markets, but changed the way they operate. Lawmakers passed the Dodd-Frank Bill, the S&P downgraded the US for the first time in history, and Facebook’s sputtering IPO has changed how new companies now come to market. The US also became a net exporter of oil and fuels for the first time in decades, the Obama Administration restored diplomatic ties with Cuba, China cemented its status as a world power, and Donald Trump rode a populist wave to the presidency.
The 2010s were also the decade of smartphones, digital streaming and five massive tech companies. Apple, Microsoft, Alphabet, Amazon and Facebook now make up 18% of the total market cap of the S&P 500, an unprecedented level of dominance. Apple and Microsoft alone accounted for 14.8% of the S&P market gains in 2019.
2019 also benefited from unprecedented levels of Fed stimulus in the form of the repurchase-agreement, or repo, market. This process involves the Federal Reserve’s purchases of treasury bills in the overnight repo market, with the purpose of adding liquidity to the markets. Markets have been on a tear since this current facility was put in place in October. So far, the Fed has used this tactic to expand its balance sheet by $400B. The last time the Fed injected this much liquidity into the markets was in 2009, when about $120B was injected into the markets in order to fuel a recovery following the credit crisis. Funds from these liquidity events usually get funneled to the best performing markets. In 2009, that was the bond market. This time around it has been the stock market, particularly mega cap stocks, that has benefited.
This Fed-fueled frenzy, combined with healthy corporate earnings ten years into an expansion, has led to significant wealth creation in 2019 alone. According to Wilshire Associates, the value of US equities increased by $7.5 trillion, or almost 28% in 2019. From the Christmas Eve 2018 low, the rise was even more pronounced, totaling about $9.2 trillion, or 36%. This past year marks the best year for value creation since 2013, when equities added $5.4 trillion to investors’ total wealth.
As we begin 2020, we remain focused on the primary drivers of investment returns – corporate earnings and valuations. Expectations are for earnings growth to slow relative to 2019, yet valuations appear to be stretched compared to this time last year. A year ago, the S&P 500 traded at roughly 19 times forward earnings and today we are at about 24.5 times forward earnings, the second highest multiple in over 10 years.
Given all of this, we have grown more cautious in our outlook as we begin 2020. Certain technical indicators that we employ in our investment process are flashing warning signs. While markets are pushing to all-time highs, money flows and relative performance are displaying divergences that have not been seen since late 1999. Market leadership has narrowed significantly, as noted earlier, best displayed by nearly half of the total return of the S&P 500 fueled by two stocks in 2019. The percentage of stocks in the S&P 500 showing positive relative performance is 34% currently, while 50%+ typically accompanies a healthy market. We are not making a major market call, rather remaining disciplined investors and have and will be trimming position sizes to reflect the elevated risk levels of the current environment. As investors, it is important not to over-emphasize individual positions but to focus on your investment portfolios as a whole. It is our responsibility to remain disciplined, to not allow emotions to block our decision making and to align our strategies with the risk management parameters that accompany them.
We are always committed to adjusting to an ever-changing landscape, performing sound research and exercising common sense. This involves not only individual security selection, but asset allocation and risk management decisions with the goal of meeting your individual investment needs.
Please feel free to contact us at your convenience to discuss your specific situation and how the various strategies that we offer can accommodate your needs. As always, we appreciate the trust and confidence you have placed in us and we appreciate the opportunity to serve your investment needs.
Scott A. Goginsky, CFA®
Partner
Research Analyst
Portfolio Manager
Sources: returns; HAS –Wealthscape, Gemini Fund Svcs, Bloomberg, USNews – earnings growth; Bloomberg – S&P 500 & DJIA 2019 YTD, CNBC.com, multpl.com, Brogan Research- decade review; Wall Street Journal, Dow Jones.com – fed reserve: Barron’s
The information set forth regarding investments was obtained from sources that we believe reliable but we do not guarantee its accuracy or completeness. Neither the information nor opinion expressed constitutes a solicitation by us of the purchase or sale of any securities. Past performance does not guarantee future results.